Wine Quality Predictor using K-Nearest Neighbors (KNN)
Project Description
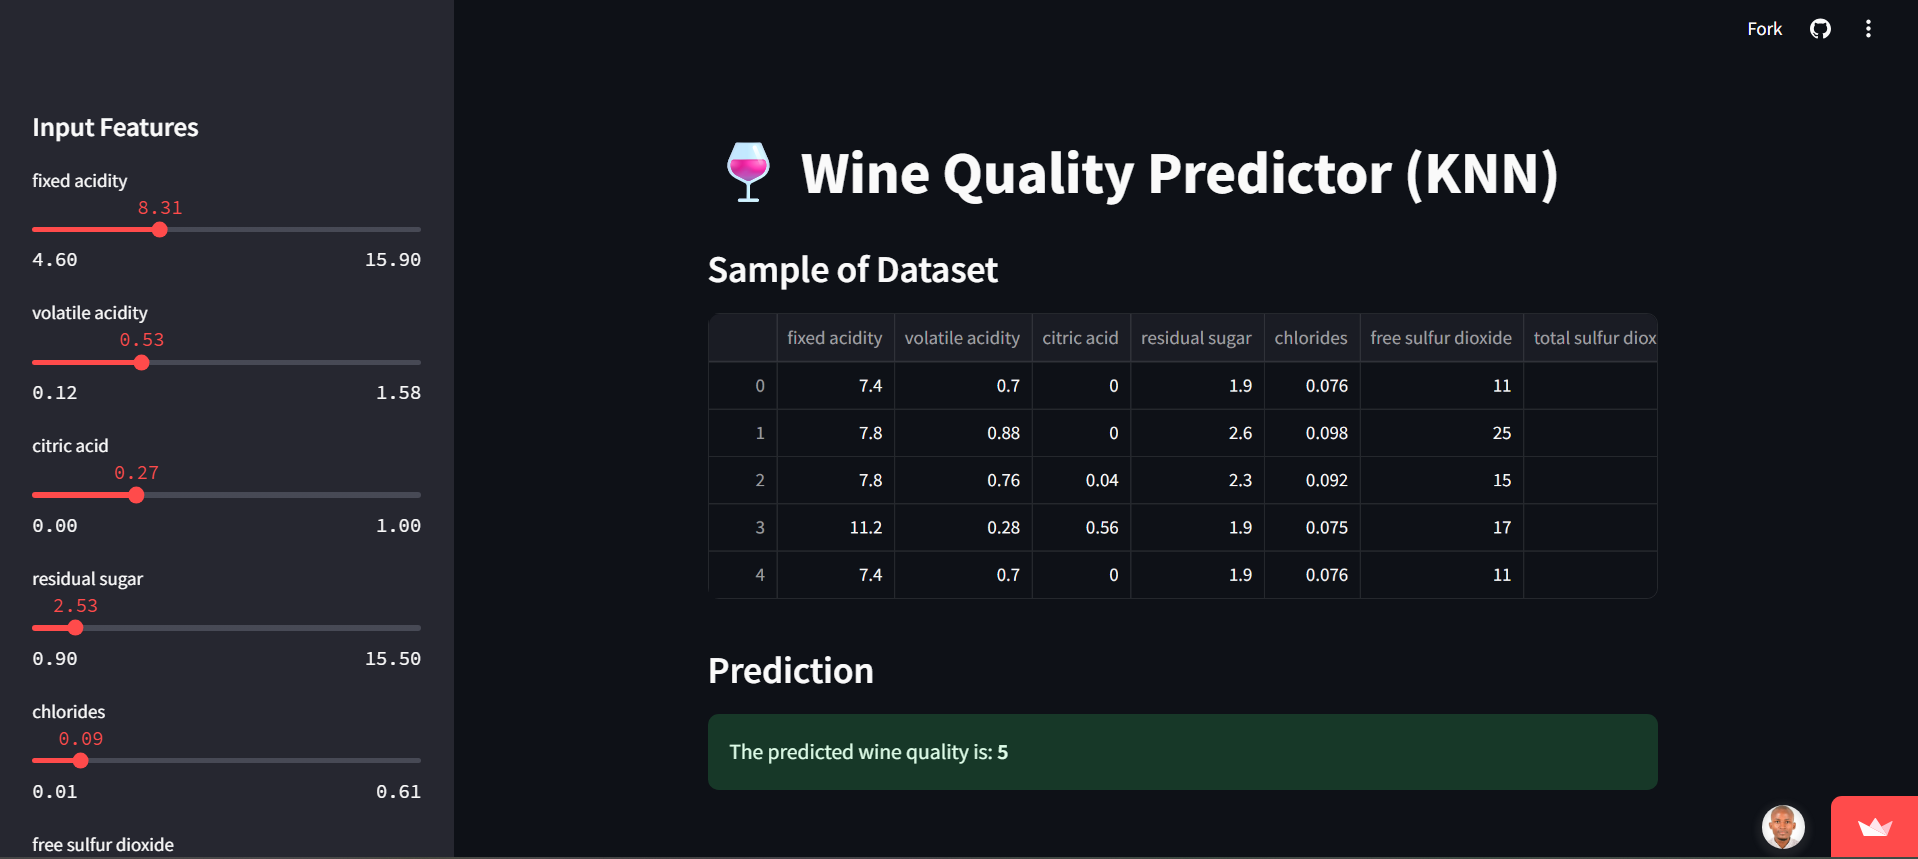
This project aims to build a machine learning model that predicts the quality of red wine based on its physicochemical properties. By analyzing various chemical components like acidity, sugar, and alcohol content, the model learns to assign a quality score (from 3 to 8). This kind of predictive model can be incredibly useful for winemakers to monitor and ensure consistent product quality.
🛠 Technologies Used
- Python - programming language
- Pandas - data manipulation
- Scikit-learn - machine learning modeling
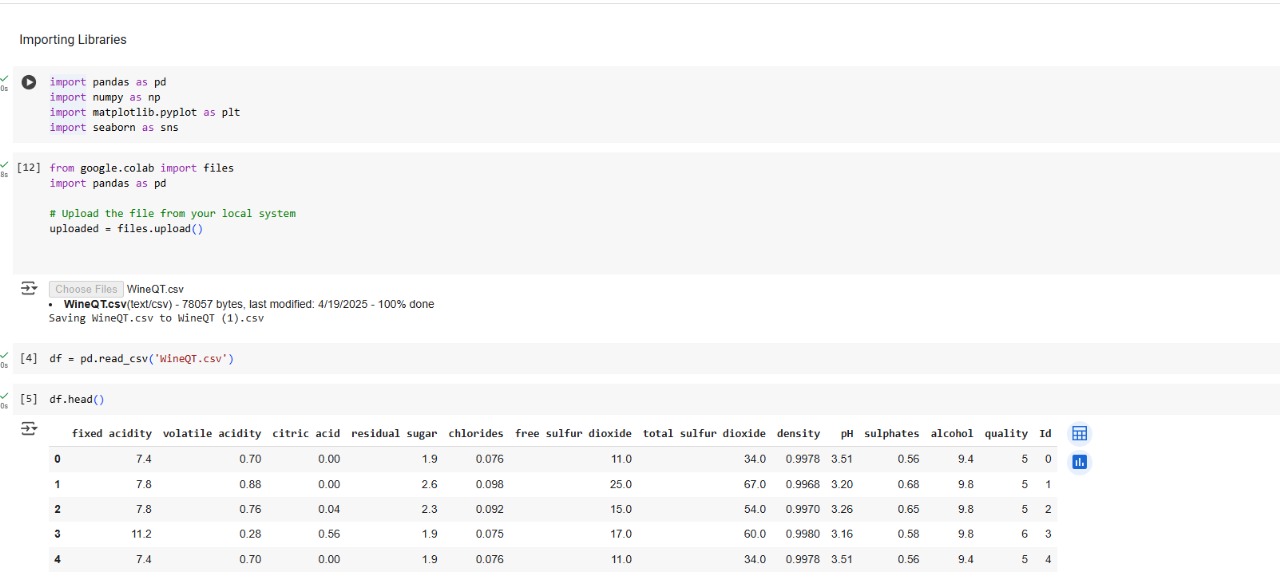
- Matplotlib & Seaborn - data visualization
- Streamlit - web-based deployment
Step 1: Gathering the Data
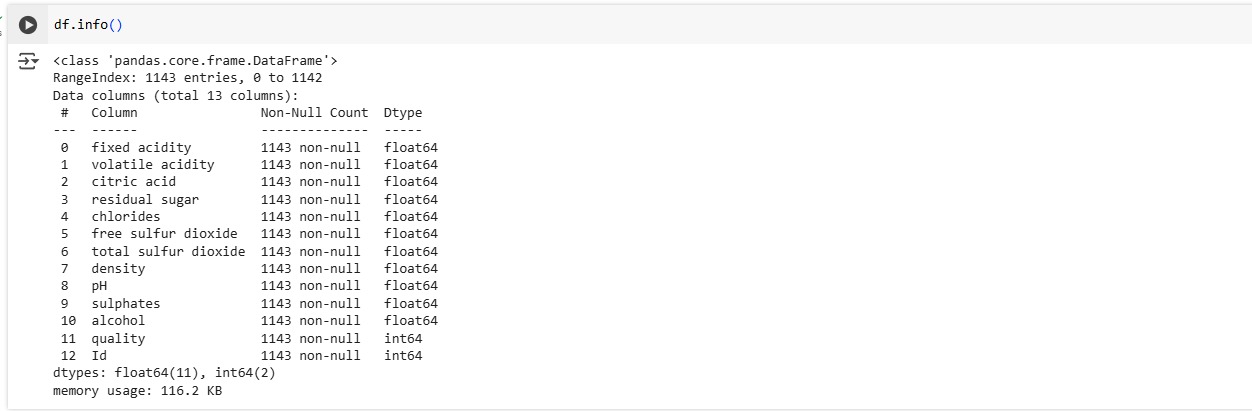
We start with a dataset containing information about various red wines, including their chemical properties (like fixed acidity, volatile acidity, citric acid, etc.) and their quality ratings. This dataset acts as our "knowledge base" for the model to learn from.
Step 2: Preparing the Data for Training
Raw data isn't always ready for a machine learning model. This step involves cleaning and transforming the data so the model can understand it better.
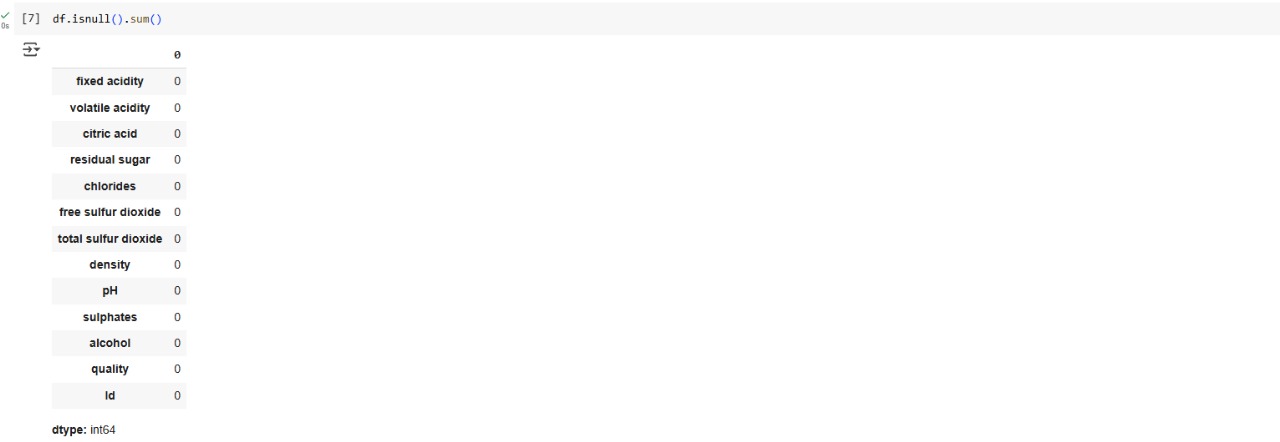
Exploratory Data Analysis (EDA)
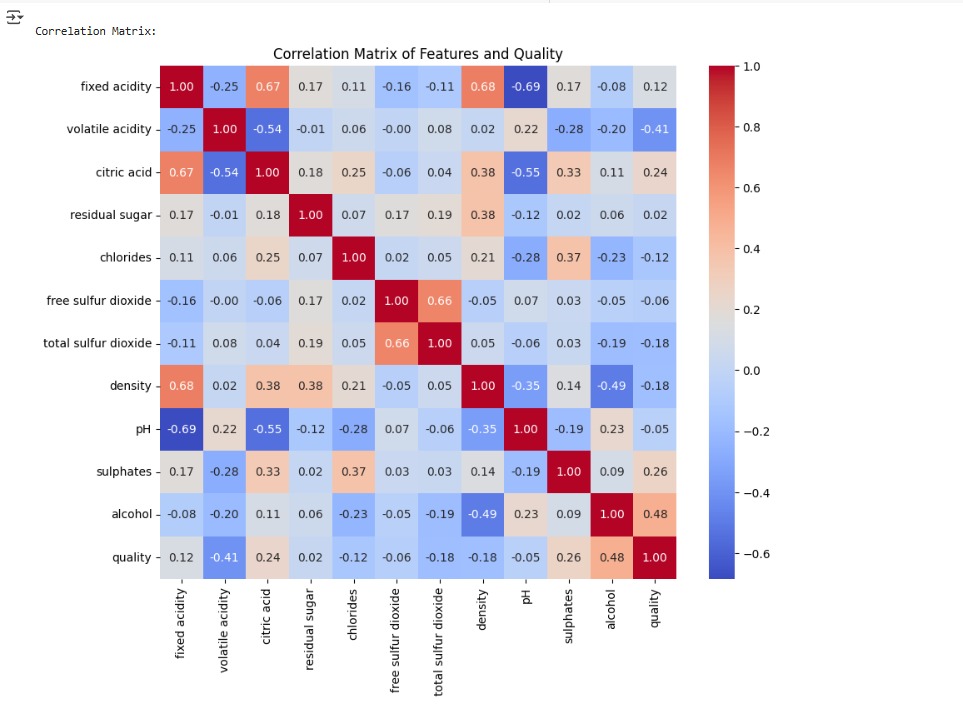
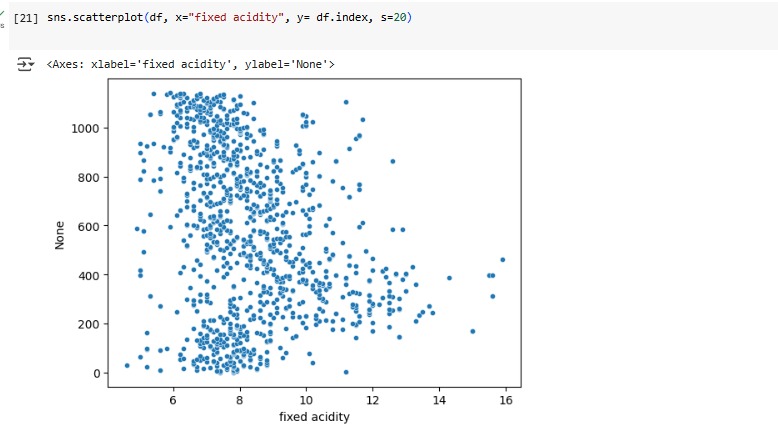
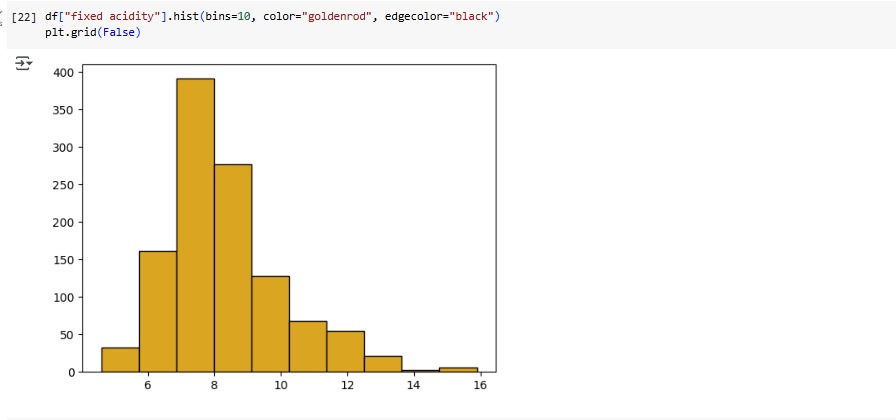
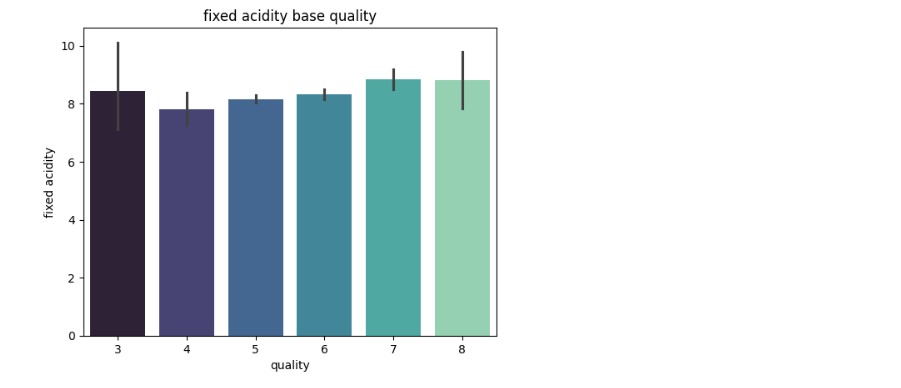
EDA is a crucial initial step in any machine learning project. Before building the prediction model, I thoroughly explored the dataset:
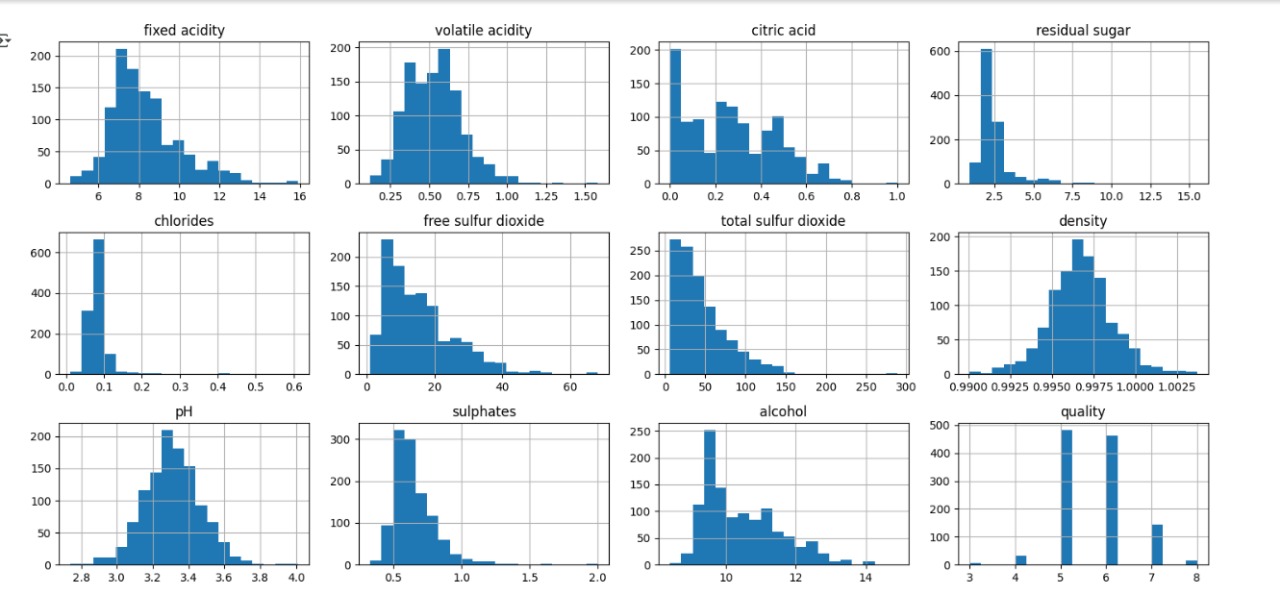
- Explored distribution of features like alcohol, acidity, and sugar
- Visualized correlations between chemical properties and quality ratings
- Identified outliers and patterns for better preprocessing
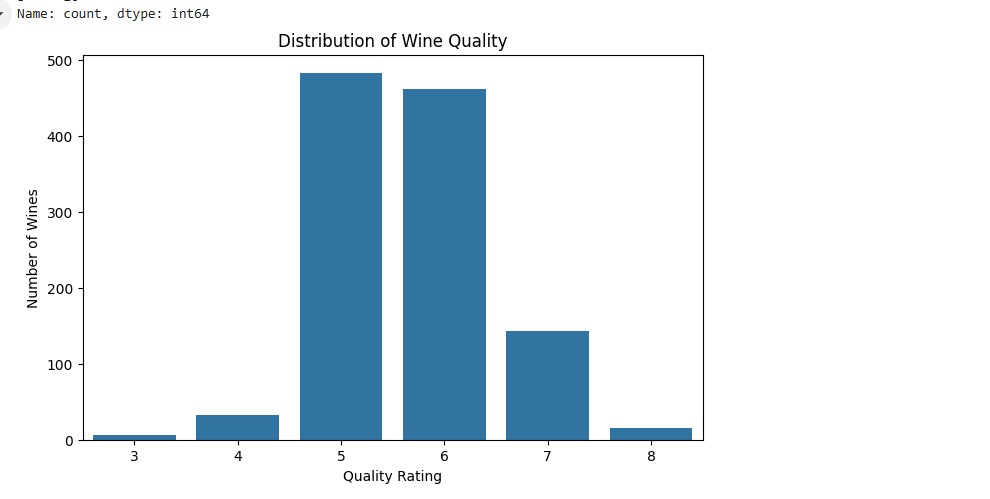
- Understood the target (quality) class imbalance
These insights guided the data cleaning and feature scaling process, improving model performance.
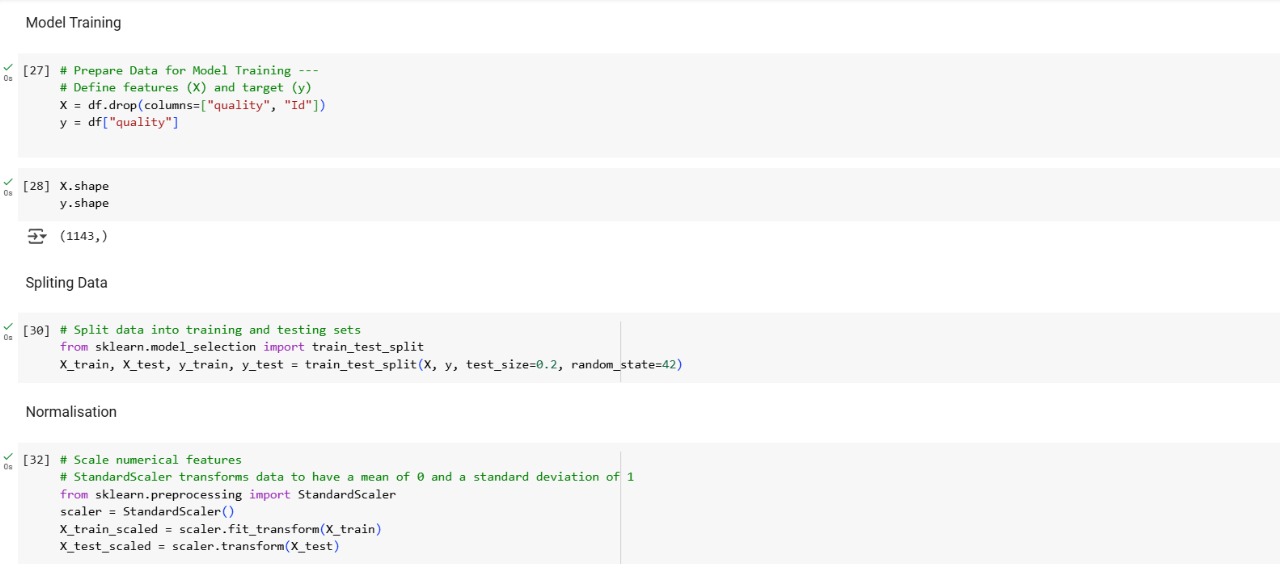
Data Splitting & Feature Scaling
After EDA, I split the dataset into:
- Features (X): All chemical properties (like alcohol, pH, etc.)
- Target (y): The wine quality rating
Then, the dataset was divided into training and testing sets (typically 80/20) to evaluate model performance on unseen data.
To ensure fairness among features, I used feature scaling. This was especially important for models like K-Nearest Neighbors (KNN), which are sensitive to feature magnitudes.